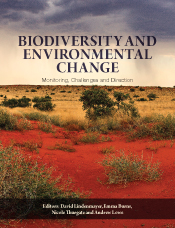
The Long Term Ecological Research Network (LTERN) is an integrated community of 12 leading Australian long-term field research plot networks. In January 2014, LTERN researchers-along with other researchers, published the book Biodiversity and Environmental Change: Monitoring, Challenges and Direction. This book provides critical field-based information on key factors that drive change in different ecosystems across Australia.
Over time, the value of long-term research networks increases as we observe environmental change and acquire temporal depth to understand the ecosystem drivers of observed change. By creating an important narrative which provides context, meaning and insights into the dynamics of each ecosystem, the book enables everyone to better understand and interpret environmental change in Australian landscapes.
Following the positive feedback for this publication, the Terrestrial Ecosystem Research Network (TERN) Advisory Board funded LTERN to publish a selection of the underlying data packages of long-term data gathered from several of the ecosystems described and studied by LTERN researchers in the book. Here we summarise these data packages and the chapters of the book where they feature. We provide context to these important contributions to our national understanding of biodiversity, and to research focusing on environmental change in Australia.
Biodiversity and Environmental Change: Monitoring, Challenges and Direction can be purchased from CSIRO Publishing here.
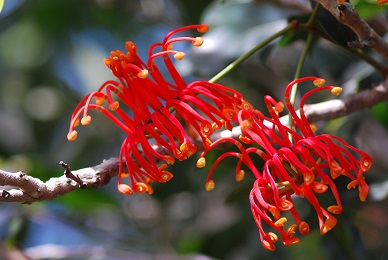
Tropical Rainforests of Eastern-Australia (Chapter 5)
Chapter authors: Daniel Metcalfe, Michael Liddell, Matt Bradford and Peter Green
The Tropical Rainforests of Eastern-Australia comprise about 0.2% of the Australian landmass. The current condition and extent of tropical rainforests of Eastern Australia is the result of a wide range of natural and human-derived factors. Despite Lowland Rainforest having largely been cleared for agricultural purposes, tropical rainforests continue to support a huge range of species. Many remaining rainforest ecosystems are now protected in Australia.
Vegetation Stem Density and Basal Area associations with Cinnamon Fungus (Phytophthora cinnamomi), Garrawalt, Northern Queensland, Australia, 1975–2009
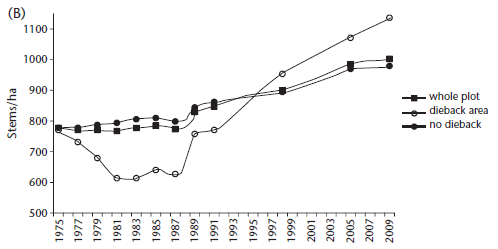
These data show the change in basal area and stem density following infection by Cinnamon Fungus (Phytophthora cinnamomi) at the Garrawalt permanent plot northwest of Townsville, North-Queensland, between 1975–2009.
These data are used to produce the graphs and conclusions in Figure 5.11 (page 133) of the book. The dataset and associated chapter demonstrate the impacts of Cinnamon Fungus on plot structure and subsequent recovery in areas of dieback in Australia's Tropical Rainforests. The research allowed the geographic extent of Cinnamon Fungus to be monitored over time, along with changes in stem-density, basal stand area, mortality rates, understorey species diversity and compensatory growth rates after the event. Molecular studies suggest that the region of likely origin of Cinnamon Fungus is in or near Papua New Guinea, and even if Cinnamon Fungus did not naturally exist in the forests of the Wet Tropics, the large overlap of genera and even species between forests of New Guinea and of Northern Australia may mean that for at least some rainforest taxa, there could be a greater degree of resistance or tolerance to the pathogen compared with the less similar forest and woodland ecosystems.
The key lesson learned from this research is that although dieback disease is still worthy of consideration as a significant threatening process in the Australian rainforests, long-term data associated with a single episode suggests that in the absence of other threats, these forests are robust enough to withstand such events. After a dieback episode, an impoverished but Cinnamon Fungus-resistant flora may develop and persist for only tens of years before Cinnamon Fungus-susceptible species recolonise the area.
To download these data and their associated metadata from the LTERN Data Portal click here.
Longitudinal Variation in Seedling Recruitment in Eight Species, Davies Creek Plot, Dinden National Park, Queensland, Australia, 1965–2004
This chapter and associated data show longitudinal variation in seedling recruitment rates over time and the standing crop of seedlings less than 30 cm tall for eight species of trees. This long-term research was undertaken at Davies Creek Plot, Dinden National Park, Queensland, Australia spanning 1965–2004. Seedlings up to 2.6 cm diameter were mapped and tagged along several permanent transects at census intervals of between 1 and 4 years.
The data are used to produce the graphs and conclusions in figure 5.18 (page 141) of the book. This research illustrates significant interspecific diversity of seedling recruitment (i.e. diversity of individuals of different species). What is most interesting about these data is the variability in recruitment intervals observed in the tree species studied. Some canopy species, including Agathis atropurpurea, Beilschmiedia bancroftii, Flindersia pimenteliana, Halfordia scleroxyla and Hylandia dockrillii, have failed to recruit juveniles for more than 4 decades, whilst other species recruit some seedlings in most years and other species show an episodic pattern in which little or no recruitment is punctuated by spectacular, supra-annual recruitment events. Although some of the variation observed can be attributed to the greater-than-annual census schedule relative to the recruitment intervals described above, the unbroken run of 11 censuses (1990–2001) shows that, in many cases, there is real underlying variation in the recruitment of seedlings for many species.
To download these data and their associated metadata from the LTERN Data Portal click here.
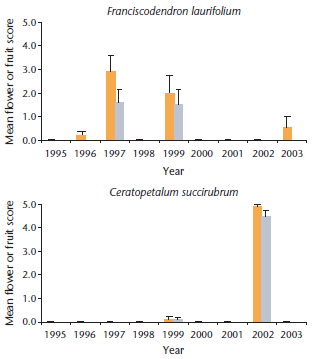
Connell Rainforest Plot Network: Annual Variation in Flowering and Fruiting in Eight Species, Davies Creek Plot, Dinden National Park, Queensland, Australia, 1995–2003
This chapter and associated data explore annual variation in flowering and fruiting phenology as a mechanism to explain temporal variation in seedling recruitment over time. The research spanned 1995 to 2003, and the graphs in Figure 5.19 (page 142) of the book show observations for the same eight trees species which were the focus of longitudinal studies examining seedling recruitment variation at the Davies Creek Plot, Dinden National Park, Queensland, Australia.
Monthly observations of flowering and fruiting on more than 700 trees belonging to 103 species were undertaken at the plot. Although some species such as Podytes Brachystylis and Citronella smythii flowered annually, approximately three quarters of the species on the plot could be considered as 'masting species'. Mast seeding is the intermittent synchronous production of large seed crops by a population of plants, typically characterised by a coefficient of variation of greater than 1.00 (the ratio of standard deviation to the mean calculated across many years). Interestingly, masting phenomena have been well known from South-east Asian Dipterocarp Rainforest for decades but a crucial difference exists between the phenomenon in these forests and those of North Queensland. Whereas the Asian masting events occurs as a synchronous, community-wide response across multiple plant families, species at the Davies Creek Connell plot followed their own idiosyncratic reproductive schedules such that no community-wide response was evident.
To download these data and their associated metadata from the LTERN Data Portal click here.
Alpine Ecosystems (Chapter 6)
Chapter authors: Richard Williams, Warwick Papst, Keith McDougall, Ian Mansergh, Dean Heinze, James Camac, Michael Nash, John Morgan and Ary Hoffmann
Alpine landscapes occupy roughly 0.04% of the Australian continent and are of national and international significance because of their tectonic, geomorphic, biotic and cultural values. The term 'alpine' refers to the treeless vegetation above the climatic limit of tree growth. On mainland Australia, the tree-line occurs at about 1600–1900 m above sea level, and at about 1000 m in Tasmania. However, trees and treeless vegetation may occur in a mosaic near the upper tree-line and the tree-line may be inverted in valleys.
The headwaters of some of Australia’s major temperate river systems originate in the Australian Alps. Globally, high mountain environments are vulnerable to the effects of climate warming and Australian alpine ecosystems have been identified as particularly vulnerable on the basis that the alpine altitudinal zone is comparatively narrow and affords limited potential for the migration of alpine species. The majority of Australia's alpine ecosystems are now protected. However, recreational uses of the alpine landscape, such as skiing, bushwalking and other outdoor adventure activities, have increased.
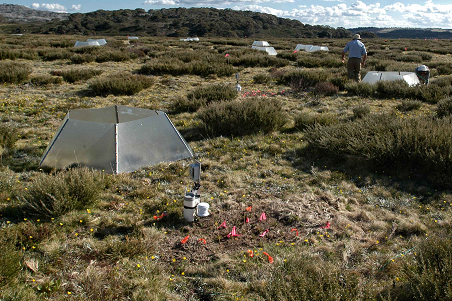
Vegetation Change and Phenology in Response to Increased Temperature, South-east Highlands, Australia, 2004–2014
This data package shows the effects of experimental warming on plants in the Victorian Alpine region spanning 2004–2014. As part of the global experimental effort known as the International Tundra Experiment (ITEX), the Australian Tundra Experiment (ATEX) was established at approximately 1750 m above sea level, on the Rocky Knob region of the Bogong High Plains part of the Victorian Alps in 2003–2004. These data are collected from two sites which were established in heathland that was unburned by the 2003 fires. At each site, 26 plots were established, each measuring 1 m2. Fifty percent of the plots were passively warmed using perspex open-topped chambers and the remaining 50% were used as control sites. Two additional plots, each consisting of seven experimentally warmed and seven control plots were established approximately 1 km from the unburned plots in heathland sites which were burned in the 2003 fires. Researchers examined the effects of increasing the near-surface soil temperature by approximately 1–2°C during the snow-free spring-autumn period compared with the control plots.
What is most interesting about these data is that the experimental design allowed researchers to examine the interactive effects of climate change and fire. This design offers rare insights into understanding vegetation changes by comparing vegetation changes detected at Core 1 (the long-term vegetation monitoring sites which are discussed elsewhere in the book) with changes detected at the experimentally warmed sites. The key findings from this research include a number of individualistic responses (such as warming-induced early flowering in numerous species across a range of life forms); compensatory behaviour (extended fruiting periods associated with early flowering), and an absence of observations showing major decline in plant diversity contrary to findings in other ITEX studies. Small experimental effects compared with ambient variation may indicate a degree of resilience in alpine grasslands and open heathlands to warming of 1–20 °C in coming decades.
The data tables consist of a subset of several data packages which have been combined to demonstrate the conclusions discussed on pages 188–191 of the book. To download these data and their associated metadata from the LTERN Data Portal click here.
Heathlands (Chapter 7)
Chapter authors: David Keith, David Lindenmayer, Andrew Lowe, Jeremy Russell-Smith, Sarah Barrett, Neal Enright, Barry Fox, Greg Guerin, David Paton, Mark Tozer and Colin Yates
In Australia, heathlands occupy a relatively small portion of the continent, covering approximately 1.3–1.9 % of the land mass. They are scattered widely around Australia's coast and associated hinterlands and ranges. Typically, trees are absent or are sparsely scattered in heathlands and when present, rarely exceed 10 m in height. Heathlands are major repositories of Australia's unique and iconic flora and also support a specialised fauna. Often situated within spectacular scenic landscapes, heathlands provide an important focus for the ecotourism industry. Although heathlands are comparatively well represented within protected areas, they are subject to ongoing threats from land clearing and associated degradation, inappropriate fire regimes, climate change and plant disease. Several heathland communities are listed as threatened under Commonwealth or state legislation, or both.
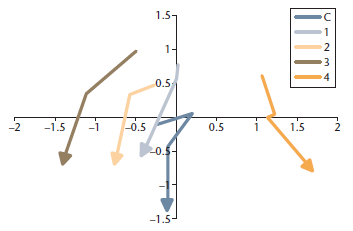
Phytophthera cinnamomi Associated with Vegetation Composition, Middleton Creek, Freycinet National Park, Tasmania, 1996–2012
Researchers examined the spread of Cinnamon Fungus (Phytophthora cinnamomi) at Middleton Creek catchment situated to the north of Freycinet National Park in Tasmania. Five transects were established in 1996 in heathlands on gently sloping east-facing slopes with quartz-rich sandy loams derived from granite geology. The four transects situated along lower aspects of the downslope were treated with phosphite spray in 1996.
These data are used to produce the graph and conclusions found in Figure 7.56 (on page 263) of the book. What is most interesting about these data is that they showed parallel trends in floristic composition across all transects over 16 years of observations, suggesting similar responses to Cinnamon Fungus invasion, irrespective of treatment. These trends commenced shortly after observations commenced in 1996 in all transects with the exception of the most topographically elevated site which had not been subject to treatment, although this site conformed to a similar trajectory after 1998. The key lesson from this research primarily relates to the severity of the response, ranging from virtual elimination of four species, including Bearded Heath (Epacris barbata) as a consequence of precipitous decline; major decline in seven species; less substantial decline in nine species and modest increases in eight species. The susceptibility to root rot disease of shrubs in plant families Fabaceae sub-family Faboidea, Proteaceae, Ericaceae, Dilleniaceae, Tremandraceae and Xanthorrhoeaceae which was already well documented in the scientific literature, was supported by the research findings. Importantly, soil seed banks remain unaffected by root rot disease, and although many heathland shrub species possess soil seed banks, susceptible hosts which lack them such as Banksia and Grass-tree species are most likely to be driven to local extinction by the disease.
To download these data and their associated metadata from the LTERN Data Portal click here.
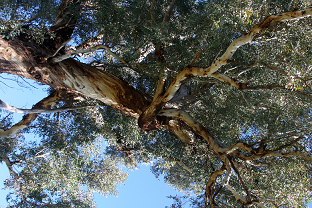
Temperate Eucalypt Woodlands (Chapter 8)
Chapter authors: David Lindenmayer, Suzanne Prober, Mason Crane, Damian Michael, Sachiko Okada, Geoff Kay, David Keith, Rebecca Montague-Drake and Emma Burns
Temperate woodlands encompass many ecological communities, habitats and species of national and global significance. They can generally be thought of as the interface between taller, wetter forested areas on the coast and the drier, hotter grasslands and shrublands of the interior. They are typically characterised by widely spaced trees and a ground layer of grasses and wildflowers. These woodlands are some of the most extensively cleared, heavily modified and highly degraded vegetation types in Australia. This is, in part, because of the suitability of these areas for cropping and/or grazing by domestic livestock. Land-use intensification and ongoing transformation to support agricultural and other developments has resulted in the loss of about 75% of these woodlands across the continent.
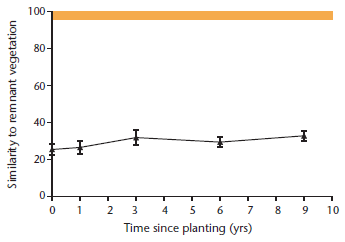
Composition of Revegetated Sites Compared with Natural Vegetation, Western Sydney Parklands (Western Sydney Regional Park), NSW, Australia, 2001
The study, undertaken in 2001 examines trends in composition of revegetated sites compared with remnant native vegetation in the first decade since woodland restoration plantings were undertaken between 1992 and 2001. The lack of convergence between revegetated areas and native woodlands in species composition suggests that there has been little colonisation in the revegetated sites by such native species as were observed at reference sites in the first decade since planting was undertaken.
These data are used to produce the graphs and conclusions found in Figure 8.30 (page 314 of the book). Despite widespread investment in restoration plantings to resolve environmental problems in woodland landscapes, the outcomes of very few projects have been systematically monitored or evaluated. What is most interesting about these data is that as plantings age and woodland structure develops, the oldest plantings are still comparatively species poor in both vascular plants and insect diversity. In other words, the plantings lack many species that tend to typify remnant woodlands and there is only weak evidence that these species are entering the re-established ecosystems over time. The key lesson from this research is the need for policies that place higher priority on the retention of woodland remnants rather than the practice of offsetting the loss of woodland remnants.
To download these data and their associated metadata from the LTERN Data Portal click here.
Northern Australian Tropical Savannas (Chapter 9)
Chapter authors: Jeremy Russell-Smith, Andrew Edwards, John Woinarski, Alaric Fisher, Brett Murphy, Mike Lawes, Beth Crase and Nicole Thurgate
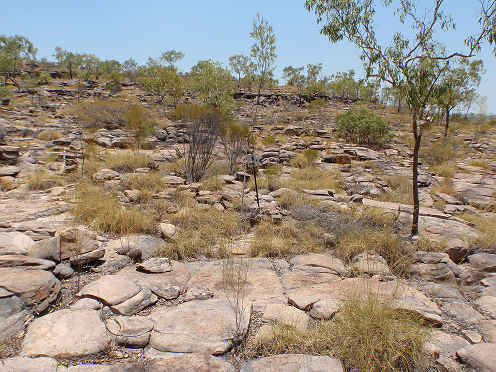
Tropical Savanna typically consists of an open tree layer with a continuous grassy ground layer. It covers approximately a quarter of the Australian continent, and the majority occurs in Northern Australia — Tropical Savanna is subject to highly summer-seasonal rainfall conditions, with mean annual rainfall generally greater than 600 mm. Australia's Tropical Savannas are used extensively for rangeland beef cattle production despite much of the land being considered, at best, to be economically marginal for pastoral production given the concurrence of low fertility soils, seasonally scarce water supplies, and distant and vicarious markets. Beyond major urban settlements, the human population is very sparse and scattered. Despite the appearance of Tropical Savanna being relatively unmodified, contemporary land uses and changed fire regimes in the savannas are having significant regional impacts on biodiversity, greenhouse gas emissions and carbon storage.
Plot-based Fire Severity Associations with Season and Frequency, Kakadu, Litchfield and Nitmiluk National Parks, Northern Territory, Australia, 1994–2013
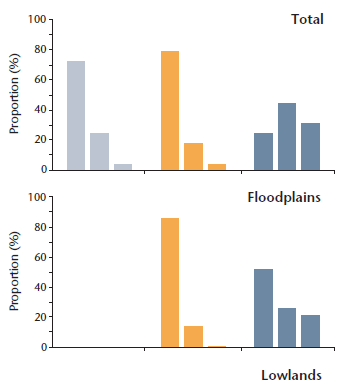
Researchers explored the relationship between the seasonal distribution of fire and fire severity in Kakadu and Nitmiluk National Parks. By using fire severity scores from the Three Parks Savanna Fire-effects Plot Network along with time since last fire data from Litchfield National Park, researchers were able to find trends between the time-since-last-fire and the frequency and severity of fire. The less frequently fires occur, the more likely that subsequent fires would be severe.
These data are used to produce the graphs and conclusions in Figure 9.16 and the associated text on pages 355–356. What is most interesting about these data is that the trends observed in relation to the time-since-last-fire and the frequency and severity of fire, highlights the difficulty in reducing the frequency and severity of fires in Northern Australia's Tropical Savanna ecosystems. The key lesson from this research is that trends observed in relation to the frequency and severity of fire imply that a negative feedback process exists between the two; a reduction in fire frequency is likely to increase the severity of fire events in these ecosystems.
To download these data and their associated metadata from the LTERN Data Portal click here.
Desert Complex Environments (Chapter 10)
Chapter authors: Christopher Dickman, Glenda Wardle, Jeff Foulkes and Nicki de Preu
Desert complex environments cover much of inland Australia and are defined as areas that are dominated by hummock grassland. These ecosystems are among Australia's most iconic and include vast undulating plains, stony deserts, rocky upland deserts and red sand dunes of the Simpson, Great Sandy, Great Victoria and Gibson Deserts. These ecosystems form vast repositories of biotic diversity and contain richer communities of lizards, small mammals and some insects than any other of the world's deserts. These complex environments generally occur more than 200–500 km inland from the coast and lie entirely within the boundaries of the arid zone — an area covering approximately 65% of Australia, characterised by variable, low rainfall (150–350 mm a year) and high rates of evapotranspiration that ensure water is usually a limiting factor.
Desert Ecology Plot Network: Mammal, Reptile and Vegetation Data Associated with Weather, Simpson Desert, Western Queensland, Australia, 1990–2011
These data illustrate the vegetation and vertebrate response to weather patterns, and the interaction between predator and prey species during these cycles.
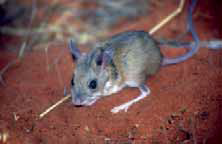
Observations showed that populations of most species rose and fell with rainfall. Populations of the Spinifext Hopping Mouse (Notomys alexis) often could not be detected during drought but their populations tended to irrupt within a few months of each rainfall event. Although populations of the Sandy Inland Mouse (Pseudomys hermannsburgensis) behaved similarly, unlike the Spinifex Hopping Mouse, numbers of this species almost never crashed to zero. Both rodent species showed some differences in the magnitude of their response to large summer rainfall events. Populations of the carnivorous marsupial Brush-tailed Mulgara (Dasycercus blythi) also fluctuated with rainfall but peaks of the capture rates for this species tended to occur 9–12 months after heavy summer rains. In contrast to the fluctuations in these rodents and the carnivorous marsupial species, the insectivorous marsupial Lesser Hairy-footed Dunnart (Sminthopsis youngsoni) showed consistent decline in heavy rainfall and recovery during drought. Peaks and declines were also detected in predator species and these tend to be several months later when compared with changes to associated prey species.
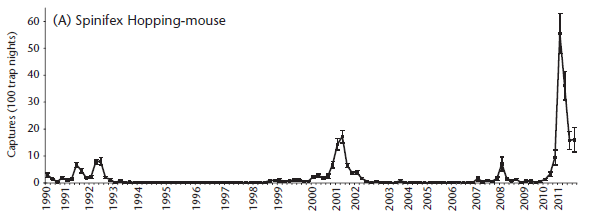
What is most interesting about these data and the key lesson associated with this research is that weather is a key driver in the dynamics of populations of small mammals in desert complex environments. These data are used to produce the graphs in Figure 10.25 (pages 411–412 of the book), and those in figures 10.20 and 10.21 (page 408 of the book).
To download these data and their associated metadata from the LTERN Data Portal click here.
Tall Eucalypt Forests (Chapter 13)
Chapter authors: Sam Wood, David Bowman, Lynda Prior, David Lindenmayer, Tim Wardlaw and Richard Robinson
Tall Eucalypt Forests are renowned for their great height and the rapid rates of the tree growth that grow within them. They contain some of the largest trees in the world — including the world's tallest flowering plant species. They are highly valued for their biodiversity, timber production and social values. In the past, these values have been threatened by land clearing for agriculture, but now the most threatening processes come from unsustainable timber harvesting and changes in the fire regimes that characterise these forests. However, these forests also undergo periodic attack from diseases and pests and may be vulnerable to changes in climate through increased temperature, decreased rainfall and the effect of the increased occurrence of extreme weather on fire regimes.
Tall eucalypt forests have a relatively narrow geographic range, comprising only 4% of forest areas in Australia or about 0.75% of the continent. Tall eucalypt forest communities are distributed across Australia in a discontinuous arc of high rainfall areas and comprise four broad groups including: (1) Northern Queensland; (2) Northern NSW and Southern Queensland; (3) Victoria and Tasmania; and (4) the South-west of Western Australia.
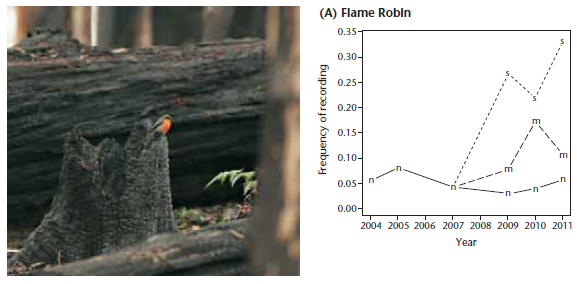
Bird Point Counts Associated with Fire Severity, Central Highlands of Victoria, Australia, 2004–2011
These data show the effects of fires on bird point counts in the Tall Eucalypt Forests of the central highlands of Victoria. Most bird species decline following severe fires, probably due to a variety of factors such as loss of habitat, food shortages, and diminished protection from predators.
These data are used to produce the graphs found in Figures 13.21 and 13.22 (page 545 of the book). What is most interesting about these data is although bird species richness has not varied significantly on unburned plots, as of mid-2012, there is clearly a highly significant effect on bird species richness, particularly associated with high fire severity burned plots. Bird species richness was significantly lower in 2009 and 2010 on unburned plots and tended to decline less abruptly in response to moderate fire severity compared with plots exposed to higher severity fire. However, in contrast to the severely burned sites, bird species richness on moderately burned sites continued to decline over the subsequent two year period.
The variability of bird species responses to fire severity is also intereting. The Crescent Honeyeater (Phylidonyris pyrrhopterus) is now absent from all burned plots but has also suffered significant decline in unburned areas as well. In contrast, the frequency of the successional specialist Flame Robins (Petroica phoenicea) tended to significantly increase following severe fires. The key lesson from this research is that in many cases, there is real underlying variation in the way that birds with differing life history characteristics respond to fire events and fire severity.
To download these data and their associated metadata from the LTERN Data Portal click here.
Purchase the book
Biodiversity and Environmental Change can be purchased online from CSIRO Publishing here.
Further information
A guide to the Long Term Ecological Research Network, Australia
To learn more about the LTERN Facility you can visit our website and download our brochure here.
On our website you will also find a series of other products, which are highlighted below. In addition, there is a publications catalogue, which provides a list of the publications associated with the 12 LTERN Plot Networks.
Policy Handbook: Learning from long-term research to better manage biodiversity in Australia
This handbook describes the key findings and messages from each of the chapters of the book, Biodiversity and Environmental Change. This booklet to provide summary information for policy makers and the general public.
The booklet contains overview information on two ecosystems not mentioned above, these are the: Chenopod and Acacia Shrublands, and Tussock Grassland. There is also a simplified explanation of concepts in ecology, discussion on the value of long-term research, a list of known and common threats to Australian biodiversity and discussion on the cultural barriers to effective environmental management in Australia.
The Policy Handbook can be downloaded, here, from the TERN website.
Making ecological monitoring successful: Insights and lessons from the Long Term Ecological Research Network
This booklet draws together the collective insights of the research leaders of the 12 LTERN Plot Networks, along with other professionals associated with the network. It provides discussion of process of the distinct characteristics of long-term research.
The lessons and insights shared in the booklet will be useful for anyone involved in supporting, designing, undertaking, or using the outputs of long-term research, and the authors hope that this enables the development of more effective and influential long-term ecological projects in Australia.
Download the Insights Booklet from the TERN website here.
The Long Term Ecological Research Network: Objectives, design and methods
The Long Term Ecological Research Network Australia describes LTERN’s conceptual design, the research underpinning the network, the objectives of the LTERN Facility, the research-questions being examined, and the field protocols being employed.
Download the full text from the TERN website here.
Funding
These data packages were curated and published using strategic funds from the Terrestrial Ecosystem Research Network (TERN) — a national research infrastructure project under the Australian Government’s National Collaborative Research Infrastructure Strategy (NCRIS).
Feedback
If you have found this project of interest, or have suggestions for future initiatives for LTERN, then please let us know via our This email address is being protected from spambots. You need JavaScript enabled to view it.
All metadata can be searched using the web interface at http://www.ltern.org.au/knb/. Data files with unrestricted 'read' settings can be downloaded directly from the web interface.
The repository stores copies of the data as instructed by the individual researchers. Researchers also have the ability to restrict access to authorised users.
To download restricted data files, you need to be authenticated before using the web interface. To do this, your username/password needs to be authenticated. To do this you should contact the This email address is being protected from spambots. You need JavaScript enabled to view it.. If you do not have a username and password, contact the This email address is being protected from spambots. You need JavaScript enabled to view it..
For further help or advice using the Long Term Ecological Research Network Data Portal please contact our Data Portal Team:
Email: This email address is being protected from spambots. You need JavaScript enabled to view it.
LTERN data is made available in accordance with the TERN data licensing policy principles.


